> ## Documentation Index
> Fetch the complete documentation index at: https://docs.bellabooking.com/llms.txt
> Use this file to discover all available pages before exploring further.
# Reports
> Generate detailed reports for in-depth business analysis
## Introduction
The **Reports** section provides detailed data tables for analysing your business performance across appointments, sales, team members, clients, and more. With 30 built-in reports, you can track everything from daily sales to future booked income, client lifetime value and peak hours. Every report exports to CSV except Online booking analytics, most offer period-over-period comparison and a totals row, and many reports can be narrowed to specific team members — appointment-based reports also support filtering by resources (rooms/equipment).
Two reports are covered in their own pages rather than below: [Tax collected](/settings/tax#the-tax-collected-report) and [Online booking analytics](/online-booking/analytics).
***
## Accessing Reports
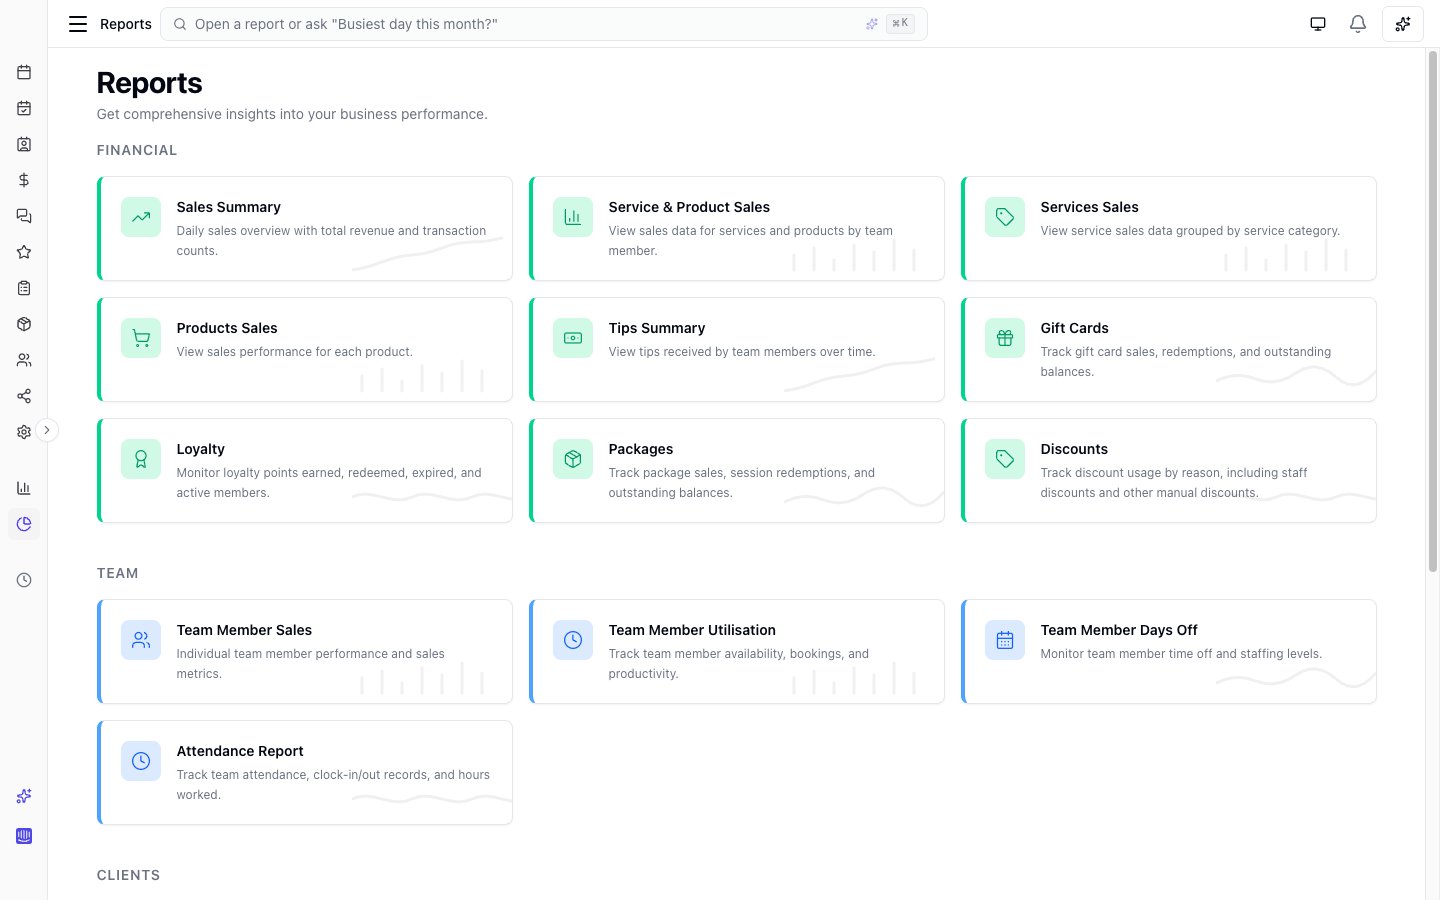
1. Navigate to **Insights** > **Reports** in the sidebar
2. You'll see a grid of all available reports
3. Click any report card to open that report
 ***
## Common Features
### Filters
Most reports include a **Date range** filter. The exceptions are Client credit summary (a live snapshot), At-risk clients and Client lifetime value (both read a client's whole history), and Online booking analytics (fixed to the last 30 days). Many reports also include:
* **Team member filter** — Multi-select to focus on specific team members. Available on: Appointments summary, Service bookings, Cancellations & no-shows, Future income, Sales summary, Service & product sales, Services sales, Products sales, Team member sales, Utilisation, Days off, Client retention, and Tips summary. The Attendance report has its own single-team-member picker instead. Leaving every team member selected is the same as applying no filter (all bookings are included, including resource-only lines with no team member).
* **Resource filter** — Multi-select to focus on specific resources (rooms/equipment). Available on appointment-based reports: Appointments summary, Service bookings, Cancellations & no-shows, Future income, and Client retention. An appointment service line can have a team member, a resource, or both — filters match either.
* **Comparison toggle** — Compare the selected period against the **previous period** (same number of days immediately before) or the **same period last year**. When enabled, delta indicators (green/red arrows with percentage change) appear on numeric columns. Available on: Appointments summary, Service bookings, Cancellations & no-shows, Sales summary, Service & product sales, Services sales (Summary view), Products sales, Team member sales, Utilisation, Client retention, Top spenders, Booking source, Gift card summary, Loyalty summary, Referrals, Birthday rewards, New client offers, Discount summary, Packages summary, Membership summary, and Tips summary.
### Summary Totals
Most reports display a **Totals** row at the bottom of the table, showing aggregated values across all matching records (not just the current page). When comparison mode is enabled, the totals row also shows delta indicators. A few reports summarise above the table instead: Future income and Attendance use summary cards, and Client credit summary shows per-currency totals at the top.
### CSV Export
Every report includes an **Export CSV** button except **Online booking analytics**, which is a multi-section funnel view rather than a single table, so there is nothing to lay out as rows and columns. The exported file contains all matching records with formatted values (currency, percentages, etc.). You can open CSV files in Excel or Google Sheets.
### Plan Availability
Every report is listed on the Reports page for anyone with report access. Reports your plan doesn't include appear **locked** with an upgrade prompt, so you can always see what's available:
* The advanced reports — Service & product sales, Team member sales, Utilisation, Client retention, Client lifetime value, At-risk clients, Top spenders, Booking source, Peak hours and Tips summary — need a plan that includes advanced reports.
* Gift card summary, Client credit summary, Loyalty summary, Packages summary and Membership summary each need the matching feature on your plan. **Referrals** unlocks with Loyalty — the two share one plan feature — and **Birthday rewards** and **New client offers** need a plan that includes messaging (running those two programmes needs Messages Plus, but reading their reports doesn't).
The one report that's hidden rather than locked is **Attendance** — it only appears once attendance tracking is switched on in your scheduling settings.
***
## Appointments summary report
The **Appointments summary** report provides a comprehensive overview of your appointment bookings, team member and resource performance, and client retention metrics.
### Filter Options
* **Date range** — The period for which appointment data should be displayed.
* **Team members** — Multi-select to filter by specific team members.
* **Resources** — Multi-select to filter by specific resources (rooms/equipment).
* **Comparison** — Compare against the previous period or same period last year.
### Data Fields
* **Team member / resource** — The name of the team member or resource. Resource rows are labelled *(resource)*. A service line with both a team member and a resource is counted under both.
* **Services** — The total number of individual services delivered by the team member within the selected period.
* **Total services value** — The total revenue generated from all services (including add-on prices) across all appointments handled by the team member.
* **Average services value** — The average revenue per service delivered (Total services value / Services count).
* **Total clients** — The total number of unique clients served by the team member.
* **New clients** — Clients who had appointments during the selected period but had no prior appointments.
* **% new clients** — Percentage of total clients that were new clients.
* **% returning clients** — Percentage of total clients that were returning clients.
* **Total appointments** — The total number of unique appointments handled by the team member.
* **% confirmed** — Percentage of appointments with "Confirmed" status.
* **% completed** — Percentage of appointments with "Completed" status.
* **% cancelled** — Percentage of appointments with "Cancelled" status.
* **No shows** — The number of appointments cancelled with a no-show reason.
* **% no show** — Percentage of total appointments that were no-shows.
* **Avg duration (mins)** — The average scheduled duration in minutes of services performed by the team member.
* **Avg actual duration (mins)** — The average time an appointment took end to end, from when its service was marked started to when it was checked out. This is a whole-appointment span (and it reflects when you check clients out, not only the service itself), so it isn't directly comparable to the per-service Avg duration above — read it on its own as a sense of how long appointments really run. Populates only for appointments where the team uses check-in and checkout.
* **Avg wait (mins)** — The average time a client waited between being checked in (arrived) and their service being started. Populates only where check-in is used.
* **% checked in** — Of the appointments completed in the period, the percentage that were checked in — a measure of how consistently the team uses check-in.
* **% on-time arrivals** — Of the checked-in appointments that were completed, the percentage where the client arrived on time — at or before the scheduled start, within a 10-minute grace window. This tracks **client** punctuality (whether clients turn up on time), not whether the business ran to schedule. Appointments started without a separate check-in are excluded.
* **% series** — The percentage of the team member's appointments that are part of a repeating series, so you can see how much of their work is recurring rather than one-off.
***
## Cancellations & no-shows report
The **Cancellations & no-shows** report provides detailed insights into cancelled appointments, helping you identify patterns and understand the reasons behind cancellations. No-shows appear as their own row alongside client-initiated cancellations.
### Filter Options
* **Date range** — The period for which cancelled appointment data should be displayed.
* **Team members** — Multi-select to filter by specific team members.
* **Resources** — Multi-select to filter by specific resources (rooms/equipment).
* **Comparison** — Compare against the previous period or same period last year.
### Data Fields
* **Reason** — The cancellation reason provided when the appointment was cancelled.
* **# appointments** — The total number of appointments cancelled with this specific reason.
* **Value** — The total monetary value of services from cancelled appointments for each reason.
* **% of total** — The percentage of all cancellations represented by this reason.
***
## Sales summary report
The **Sales summary** report provides a day-by-day overview of your business's sales performance, including services, products, payment breakdowns, and refunds.
***
## Common Features
### Filters
Most reports include a **Date range** filter. The exceptions are Client credit summary (a live snapshot), At-risk clients and Client lifetime value (both read a client's whole history), and Online booking analytics (fixed to the last 30 days). Many reports also include:
* **Team member filter** — Multi-select to focus on specific team members. Available on: Appointments summary, Service bookings, Cancellations & no-shows, Future income, Sales summary, Service & product sales, Services sales, Products sales, Team member sales, Utilisation, Days off, Client retention, and Tips summary. The Attendance report has its own single-team-member picker instead. Leaving every team member selected is the same as applying no filter (all bookings are included, including resource-only lines with no team member).
* **Resource filter** — Multi-select to focus on specific resources (rooms/equipment). Available on appointment-based reports: Appointments summary, Service bookings, Cancellations & no-shows, Future income, and Client retention. An appointment service line can have a team member, a resource, or both — filters match either.
* **Comparison toggle** — Compare the selected period against the **previous period** (same number of days immediately before) or the **same period last year**. When enabled, delta indicators (green/red arrows with percentage change) appear on numeric columns. Available on: Appointments summary, Service bookings, Cancellations & no-shows, Sales summary, Service & product sales, Services sales (Summary view), Products sales, Team member sales, Utilisation, Client retention, Top spenders, Booking source, Gift card summary, Loyalty summary, Referrals, Birthday rewards, New client offers, Discount summary, Packages summary, Membership summary, and Tips summary.
### Summary Totals
Most reports display a **Totals** row at the bottom of the table, showing aggregated values across all matching records (not just the current page). When comparison mode is enabled, the totals row also shows delta indicators. A few reports summarise above the table instead: Future income and Attendance use summary cards, and Client credit summary shows per-currency totals at the top.
### CSV Export
Every report includes an **Export CSV** button except **Online booking analytics**, which is a multi-section funnel view rather than a single table, so there is nothing to lay out as rows and columns. The exported file contains all matching records with formatted values (currency, percentages, etc.). You can open CSV files in Excel or Google Sheets.
### Plan Availability
Every report is listed on the Reports page for anyone with report access. Reports your plan doesn't include appear **locked** with an upgrade prompt, so you can always see what's available:
* The advanced reports — Service & product sales, Team member sales, Utilisation, Client retention, Client lifetime value, At-risk clients, Top spenders, Booking source, Peak hours and Tips summary — need a plan that includes advanced reports.
* Gift card summary, Client credit summary, Loyalty summary, Packages summary and Membership summary each need the matching feature on your plan. **Referrals** unlocks with Loyalty — the two share one plan feature — and **Birthday rewards** and **New client offers** need a plan that includes messaging (running those two programmes needs Messages Plus, but reading their reports doesn't).
The one report that's hidden rather than locked is **Attendance** — it only appears once attendance tracking is switched on in your scheduling settings.
***
## Appointments summary report
The **Appointments summary** report provides a comprehensive overview of your appointment bookings, team member and resource performance, and client retention metrics.
### Filter Options
* **Date range** — The period for which appointment data should be displayed.
* **Team members** — Multi-select to filter by specific team members.
* **Resources** — Multi-select to filter by specific resources (rooms/equipment).
* **Comparison** — Compare against the previous period or same period last year.
### Data Fields
* **Team member / resource** — The name of the team member or resource. Resource rows are labelled *(resource)*. A service line with both a team member and a resource is counted under both.
* **Services** — The total number of individual services delivered by the team member within the selected period.
* **Total services value** — The total revenue generated from all services (including add-on prices) across all appointments handled by the team member.
* **Average services value** — The average revenue per service delivered (Total services value / Services count).
* **Total clients** — The total number of unique clients served by the team member.
* **New clients** — Clients who had appointments during the selected period but had no prior appointments.
* **% new clients** — Percentage of total clients that were new clients.
* **% returning clients** — Percentage of total clients that were returning clients.
* **Total appointments** — The total number of unique appointments handled by the team member.
* **% confirmed** — Percentage of appointments with "Confirmed" status.
* **% completed** — Percentage of appointments with "Completed" status.
* **% cancelled** — Percentage of appointments with "Cancelled" status.
* **No shows** — The number of appointments cancelled with a no-show reason.
* **% no show** — Percentage of total appointments that were no-shows.
* **Avg duration (mins)** — The average scheduled duration in minutes of services performed by the team member.
* **Avg actual duration (mins)** — The average time an appointment took end to end, from when its service was marked started to when it was checked out. This is a whole-appointment span (and it reflects when you check clients out, not only the service itself), so it isn't directly comparable to the per-service Avg duration above — read it on its own as a sense of how long appointments really run. Populates only for appointments where the team uses check-in and checkout.
* **Avg wait (mins)** — The average time a client waited between being checked in (arrived) and their service being started. Populates only where check-in is used.
* **% checked in** — Of the appointments completed in the period, the percentage that were checked in — a measure of how consistently the team uses check-in.
* **% on-time arrivals** — Of the checked-in appointments that were completed, the percentage where the client arrived on time — at or before the scheduled start, within a 10-minute grace window. This tracks **client** punctuality (whether clients turn up on time), not whether the business ran to schedule. Appointments started without a separate check-in are excluded.
* **% series** — The percentage of the team member's appointments that are part of a repeating series, so you can see how much of their work is recurring rather than one-off.
***
## Cancellations & no-shows report
The **Cancellations & no-shows** report provides detailed insights into cancelled appointments, helping you identify patterns and understand the reasons behind cancellations. No-shows appear as their own row alongside client-initiated cancellations.
### Filter Options
* **Date range** — The period for which cancelled appointment data should be displayed.
* **Team members** — Multi-select to filter by specific team members.
* **Resources** — Multi-select to filter by specific resources (rooms/equipment).
* **Comparison** — Compare against the previous period or same period last year.
### Data Fields
* **Reason** — The cancellation reason provided when the appointment was cancelled.
* **# appointments** — The total number of appointments cancelled with this specific reason.
* **Value** — The total monetary value of services from cancelled appointments for each reason.
* **% of total** — The percentage of all cancellations represented by this reason.
***
## Sales summary report
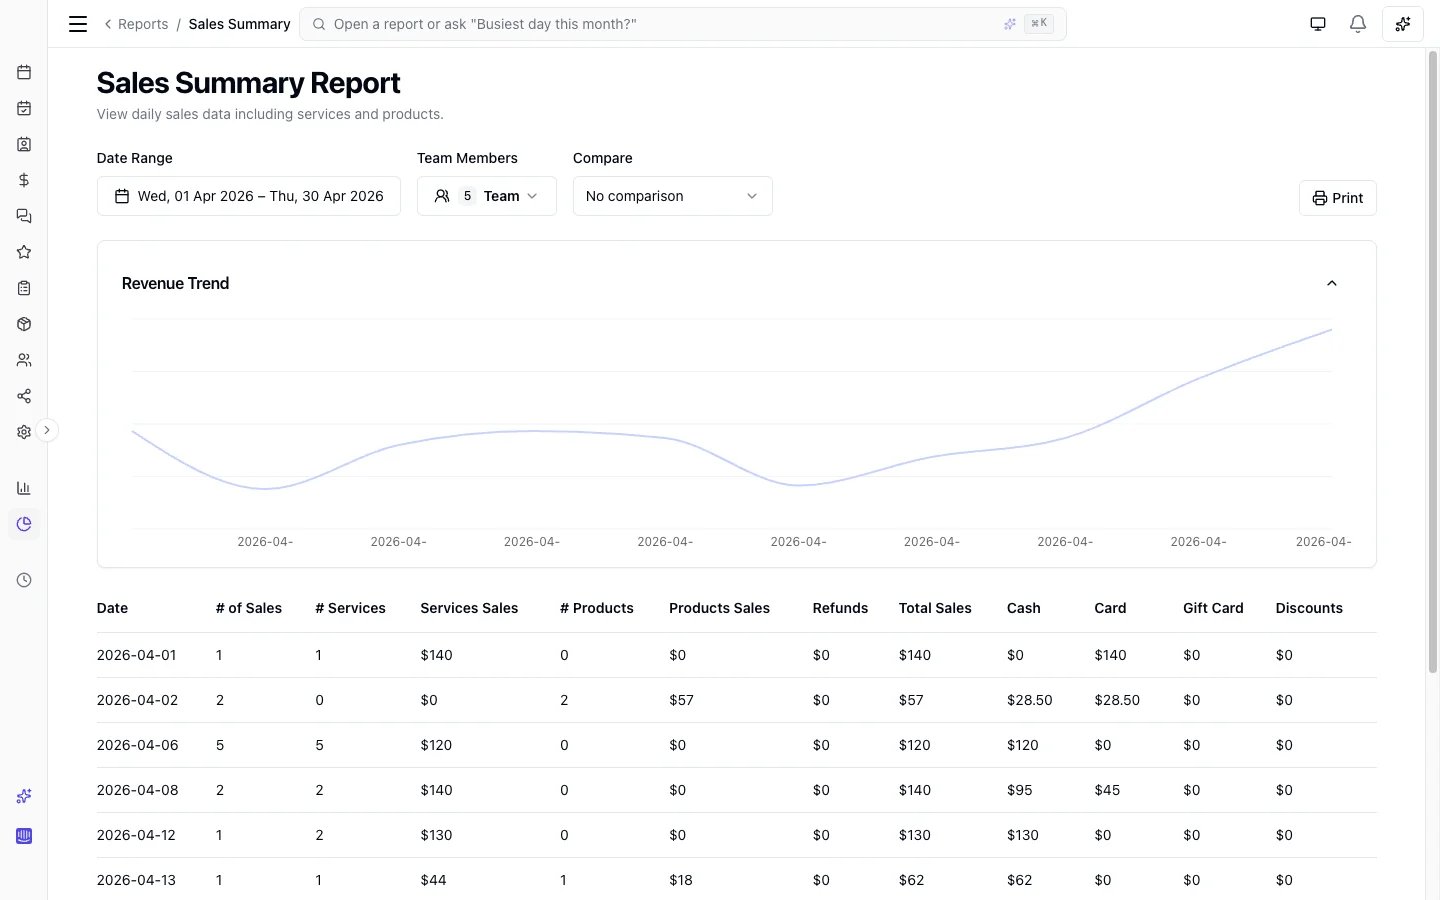
The **Sales summary** report provides a day-by-day overview of your business's sales performance, including services, products, payment breakdowns, and refunds.
 ### Filter Options
* **Date range** — The period for which daily sales data should be displayed.
* **Team members** — Multi-select to filter by specific team members.
* **Comparison** — Compare against the previous period or same period last year.
### Data Fields
* **Date** — The sale date (the calendar day the sale was rung, or the day your team set as the sale date). This is not the appointment date — if you check out an appointment the day after it happened, revenue lands here on the checkout/sale date unless you change **Sale date** at checkout or via **Edit sale**.
* **# of sales** — The total number of unique sales transactions completed on that date.
* **# services** — The total count of individual service items sold on that date.
* **Services sales** — The total revenue generated from service sales on that date.
* **# products** — The total count of individual product items sold on that date.
* **Products sales** — The total revenue generated from product sales on that date.
* **# custom items** — The total count of custom (one-off) items sold on that date.
* **Custom items sales** — The total revenue from those custom items.
* **Refunds** — The total value of refunds processed on that date.
* **Total sales** — The net sales value (services + products + custom items − refunds).
* **Cash** — Total payments received in cash.
* **Card** — Total payments received by credit/debit card (including card on file).
* **Gift card** — Total payments received via gift card redemptions.
* **Client credit** — Total payments taken from clients' stored-value credit balances.
* **Other** — Any remaining tenders (e.g. package redemptions), so the payment breakdown always adds up to the total.
**How deposits are counted.** An appointment deposit is attributed to the method it was actually taken with — a card deposit lands in **Card**, a cash deposit in **Cash** — separately from whatever settled the remaining balance. So a $180 appointment with a $43 card deposit finished in cash reports $43 of card and $137 of cash, which is what your card statement and your till will show. Deposits are counted on the **checkout date**, not the day the client paid the deposit. Appointments checked out before August 2026 include the deposit in the tender that settled the balance, so earlier periods keep the figures you have already reported on.
* **Discounts** — Total discounts applied to sales (loyalty rewards and manual discounts).
***
## Future income report
The **Future income** report shows the expected income from your **upcoming, not-yet-completed appointments** — your booked pipeline — **net of any manual and promo-code discounts** already applied. It answers "how much have I actually got on the books?" without waiting for checkout. It counts appointments with a **Booked** or **Confirmed** status that fall in the window you choose; completed and cancelled appointments (including no-shows) are excluded.
> **What's included:** the figure is net of the **manual discounts and promo codes** already on each appointment. Memberships, packages, loyalty rewards and gift cards are only applied at checkout, so they are **not** deducted here — the final amount collected may be lower for a client who redeems one. Tips and taxes aren't included either, as they're added at checkout.
### Filter Options
* **Date range** — A forward window with quick presets for **Next 7 days**, **Next 30 days**, **Next 90 days** (the default) and **Next month**, plus any custom range.
* **Team members** — Multi-select to filter by specific team members.
* **Resources** — Multi-select to filter by specific resources (rooms/equipment).
### Summary
* **Expected net income** — Gross booked value less manual and promo-code discounts, across all matching appointments.
* **Gross booked** — The total booked value before discounts.
* **Discounts** — The total manual and promo-code discounts applied. A percentage of gross is also shown once you have enough upcoming appointments for it to be meaningful.
* **Deposits held** — Deposits already collected against these appointments.
* **Balance to collect** — Expected net income less deposits already held.
A trend chart shows expected net income across the window, grouped by day, week or month depending on how far ahead you're looking.
### Data Fields (by team member / resource)
* **Team member / resource** — The name of the team member or resource. Resource rows are labelled *(resource)*.
* **Appointments** — The number of upcoming appointments they're part of.
* **Gross** — The booked value of their services before discounts.
* **Discounts** — Their share of the manual and promo-code discounts.
* **Net** — Gross less discounts.
### Use Cases
* Track the income you have booked for the weeks ahead and plan cash flow.
* See how discounts and promo codes are affecting your forward revenue.
* Spot quiet weeks early so you can promote them before they arrive.
***
## Service & product sales report
The **Service & product sales** report provides a comprehensive view of sales performance broken down by team member, showing both service and product sales separately with percentage splits.
### Filter Options
* **Date range** — The period for which sales data should be displayed.
* **Team members** — Multi-select to filter by specific team members.
* **Comparison** — Compare against the previous period or same period last year.
### Data Fields
* **Team member** — The name of the team member.
* **# of services** — The total count of individual service items sold by the team member.
* **Service sales** — The total revenue generated from service sales by the team member.
* **# products** — The total count of individual product items sold by the team member.
* **Product sales** — The total revenue generated from product sales by the team member.
* **Total sales** — The combined revenue from both services and products.
* **Service %** — The percentage of total sales from services.
* **Product %** — The percentage of total sales from products.
***
## Service bookings report
The **Service bookings** report shows how many times each service was **booked** — counted from appointment service lines by **appointment date**, excluding cancelled appointments. Use this when you want popularity by bookings, including appointments that have not been checked out yet.
This is **not** the same as [Services sales](#services-sales-report), which counts services **sold at checkout**.
### Filter Options
* **Date range** — Filters on the **appointment date** (the day the appointment is scheduled for).
* **Team members** — Multi-select to focus on specific team members (matches the team member on each service line).
* **Resources** — Multi-select to focus on specific resources (matches the resource on each service line). Lines may have a team member, a resource, or both.
* **Comparison** — Compare against the previous period or same period last year.
### Data Fields
* **Service name** — The name of the individual service.
* **Service category** — The category that this service belongs to.
* **# bookings** — The number of non-cancelled appointment service lines for this service. A multi-service appointment contributes one count per service line. Bundle components each count as their own line. Variants of the same service are rolled into that service.
* **% of bookings** — This service’s share of all booking lines in the period.
* **Avg duration (mins)** — The average booked duration in minutes for this service’s lines.
***
## Services sales report
The **Services sales** report provides detailed insights into the performance of individual services **at checkout**, including pricing, revenue share, and duration metrics.
The date filter uses the **checkout date** (when the sale was completed), not the appointment date. Appointments that were booked but never checked out do not appear here. For booking counts by appointment date, use [Service bookings](#service-bookings-report).
The report has two views: **Summary** (one row per service, aggregated over the period) and **Detailed** (one row per service sold, with dates — handy for exporting CSVs into bookkeeping or cashflow spreadsheets).
### Filter Options
* **Date range** — The period of **checkout dates** to include.
* **Team members** — Multi-select to filter by specific team members.
* **Comparison** — Compare against the previous period or same period last year. Available in the Summary view only — the Detailed view lists individual lines, so there is nothing to compare period-on-period.
### Data Fields
* **Service name** — The name of the individual service.
* **Service category** — The category that this service belongs to.
* **# services** — The total number of times this service was **sold** at checkout.
* **Sales** — The total revenue generated from this service, net of any refunds.
* **Avg price** — The average price per service instance.
* **% of revenue** — The percentage of total service revenue represented by this service.
* **Avg duration (mins)** — The average duration in minutes for this service.
### Data Fields (Detailed view)
* **Date of service** — The date the service was performed (the appointment date; for walk-in sales, the checkout date).
* **Checkout date** — The date the sale was checked out.
* **Service** — The service name (including the variant, where applicable).
* **Bundle** — The bundle this line was sold as part of, or a dash when the service was sold on its own. A bundle is sold as one line per component service, so each component keeps its own row.
* **Service category** — The category that this service belongs to.
* **Team member** — Who performed the service.
* **Gross** — The price charged on the sale for that line, before any per-service discount or refund. Where a package session covered the service, the covered portion is already taken off.
* **Net** — Gross less that line's share of any per-service membership or manual discount, and less its share of any refund. This is the figure that reconciles with the Summary view's Sales total.
***
## Products sales report
The **Products sales** report provides detailed insights into retail product performance, showing which products are selling well, their average price, and revenue share.
### Filter Options
* **Date range** — The period for which product sales data should be displayed.
* **Team members** — Multi-select to filter by specific team members.
* **Comparison** — Compare against the previous period or same period last year.
### Data Fields
* **Product** — The name of the retail product.
* **# products** — The total quantity of this product sold.
* **Sales** — The total revenue generated from this product.
* **Avg price** — The average price per unit sold.
* **% of revenue** — The percentage of total product revenue represented by this product.
***
## Team member sales report
The **Team member sales** report provides comprehensive sales performance metrics for each team member, including productivity measures like service hours and sales per hour.
### Filter Options
* **Date range** — The period for which team member sales data should be displayed.
* **Team members** — Multi-select to filter by specific team members.
* **Comparison** — Compare against the previous period or same period last year.
### Data Fields
* **Team member** — The name of the team member.
* **# of sales** — The total number of unique sales that include items attributed to this team member.
* **Total sales** — The total revenue from all items attributed to this team member.
* **Avg services per sale** — The average number of service items per sale.
* **Avg products per sale** — The average number of product items per sale.
* **Average sale value** — The average value of items per sale (Total sales / # of sales).
* **Service hours** — The total hours of services delivered by the team member.
* **Sales per hour** — Revenue generated per service hour (Total sales / Service hours).
***
## Utilisation report
The **Utilisation** report provides insights into how effectively your team members' available working hours are being utilised, including revenue metrics.
### Filter Options
* **Date range** — The period for which utilisation data should be displayed.
* **Team members** — Multi-select to filter by specific team members.
* **Comparison** — Compare against the previous period or same period last year.
### Data Fields
* **Team member** — The name of the team member.
* **Available hours** — The total hours the team member was scheduled to work, excluding time off and blocked time.
* **Booked** — The total hours booked with client appointments.
* **Unbooked** — The available hours not booked (Available hours − Booked).
* **% utilisation** — The percentage of available hours that were booked (Booked / Available hours × 100).
* **Revenue** — The total sales revenue generated by the team member during the period.
* **Revenue per hour** — Revenue divided by booked hours (Revenue / Booked).
***
## Days off report
The **Days off** report provides a detailed listing of all scheduled time off for your team members, including the duration and hours impact.
### Filter Options
* **Date range** — The period for which time-off data should be displayed.
* **Team members** — Multi-select to filter by specific team members.
### Data Fields
* **Team member** — The name of the team member who has scheduled time off.
* **Day** — The specific date of the time off.
* **Type** — The type of time off.
* **Total days off** — The total number of days off for this team member in the selected period.
* **Hours missed** — The total working hours missed due to the time off, based on the team member's scheduled working hours.
***
## Client retention report
The **Client retention** report tracks new versus returning clients and rebooking rates by team member and resource, helping you measure client loyalty and identify retention opportunities.
### Filter Options
* **Date range** — The period for which retention data should be displayed.
* **Team members** — Multi-select to filter by specific team members.
* **Resources** — Multi-select to filter by specific resources (rooms/equipment).
* **Comparison** — Compare against the previous period or same period last year.
### Data Fields
* **Team member / resource** — The name of the team member or resource. Resource rows are labelled *(resource)*.
* **Total clients** — The total number of unique clients served by that team member or resource.
* **New clients** — Clients who had their first-ever appointment during the selected period.
* **Returning clients** — Clients who had previous appointments before the selected period.
* **Retention rate (%)** — The percentage of clients who are returning (Returning clients / Total clients × 100).
* **Rebooking rate (%)** — The percentage of clients who have a future appointment booked at the time of viewing.
***
## Booking source report
The **Booking source** report shows where your bookings come from, helping you understand the effectiveness of your online booking page versus manual bookings.
This report tracks the booking **origin** — whether an appointment was created by the client online, by your team on the dashboard, or through your own website integration. That's different from the traffic **channel** (Instagram, Google, an AI assistant, and so on) that sends a visitor to your booking page, which you'll find under [Online booking analytics](/online-booking/analytics).
### Filter Options
* **Date range** — The period for which booking source data should be displayed.
* **Comparison** — Compare against the previous period or same period last year.
### Data Fields
* **Source** — The booking origin: **Online** (the client booked themselves), **Team Booking** (someone on your team booked it on the dashboard — including appointments imported from a previous system), or **Integration** (created through your own API key — typically a booking form on your own website). Appointments created before Bella tracked booking origins appear as **Unknown**.
* **Appointments** — The total number of appointments from this source.
* **Revenue** — The total revenue generated from appointments booked through this source.
* **% of total** — The percentage of all appointments represented by this source.
* **Average value** — The average revenue per appointment from this source.
***
## Gift card summary report
The **Gift card summary** report tracks gift card sales (including cash / card / other / online amounts collected), redemptions, and outstanding balances over time. Use it to reconcile till payments taken for gift cards. Available on plans that include gift cards.
### Filter Options
* **Date range** — The period for which gift card data should be displayed.
* **Comparison** — Compare against the previous period or same period last year.
### Data Fields
* **Date** — The date for the gift card activity.
* **Gift cards sold** — The number of gift cards sold on that date.
* **Total sold amount** — The total monetary value of gift cards sold.
* **Gift cards redeemed** — The number of gift cards that had redemptions on that date.
* **Total redeemed amount** — The total monetary value redeemed from gift cards.
* **Outstanding balance** — The remaining unredeemed balance across all gift cards as of that date.
***
## Client credit summary report
The **Client credit summary** report shows your total outstanding [Client credit](/client-credit) (stored-value) liability **right now** — it's a point-in-time snapshot, not a date range. Available on plans that include client credit. Use it for reconciliation and to see exactly how much stored value you owe clients.
### Data Fields
* **Client** — Each client currently holding a balance (searchable; export to CSV for reconciliation).
* **Balance** — The client's total spendable credit.
* **Paid** — The portion that is the client's own money (top-ups and refunds-to-credit).
* **Bonus** — The promotional-bonus portion, kept separate so your true liability is clear.
* **Currency** — The currency the balance is held in (a client's balance is locked to one currency).
Per-currency totals are summarised at the top. A **Reconcile balances** button checks each cached balance against its transaction ledger. If any have drifted, team members with the **Client Credit → Manage client credit** permission also get a **Repair** action that rewrites the drifted balances from the ledger.
***
## Loyalty summary report
The **Loyalty summary** report monitors loyalty programme activity including points earned, redeemed, and expired. Available on plans that include the loyalty programme.
### Filter Options
* **Date range** — The period for which loyalty data should be displayed.
* **Comparison** — Compare against the previous period or same period last year.
### Data Fields
* **Date** — The date for the loyalty activity.
* **Points earned** — The total loyalty points earned by clients on that date.
* **Points redeemed** — The total loyalty points redeemed by clients on that date.
* **Points expired** — The total loyalty points that expired on that date.
* **Rewards redeemed** — The number of loyalty rewards claimed on that date.
* **Active members** — The number of clients with a non-zero points balance as of that date.
***
## Referrals report
The **Referrals** report tracks how your referral programme is performing day by day — successful referrals, the rewards they generate, and the value of the discounts clients redeem. Available on plans that include loyalty/referrals — see [Referrals](/programmes/referrals).
### Filter Options
* **Date range** — The period for which referral data should be displayed.
* **Comparison** — Compare against the previous period or same period last year.
### Data Fields
* **Date** — The date for the referral activity.
* **Conversions** — The number of successful referrals on that date. A conversion is counted when a referred friend completes their first paid visit and the referrer earns their reward.
* **Rewards issued** — The number of referral rewards created on that date, counting both the referred friend's welcome reward and the referrer's earned reward.
* **Redeemed** — The number of referral rewards redeemed at checkout on that date. A reward issued on an earlier date may be redeemed within the selected range, so the issued and redeemed counts on a single row need not match.
* **Reward value** — The total discount applied by the referral rewards redeemed on that date.
***
## Birthday rewards report
The **Birthday rewards** report tracks how your [birthday reward](/programmes/birthday) is performing — the birthday rewards clients redeem at checkout and the discount value those redemptions give. Available on plans that include messaging; the birthday reward itself is part of Messages Plus.
> **Snapshot:** At the top of the report, a callout shows how many clients have a birthday in the current month and the percentage of your active clients who have a date of birth on file. These are current totals — they do not change with the date range, so you can gauge how complete your birthday data is and how many clients are eligible this month. Only the table below follows the selected dates.
### Filter Options
* **Date range** — The period for which birthday reward data should be displayed. The snapshot callout above is independent of this range.
* **Comparison** — Compare against the previous period or same period last year. The comparison applies only to the rewards redeemed and reward value, not to the current snapshot.
### Data Fields
* **Date** — The date for the birthday reward activity.
* **Rewards redeemed** — The number of birthday rewards redeemed at checkout on that date.
* **Reward value** — The total discount applied by the birthday rewards redeemed on that date.
***
## New client offers report
The **New client offers** report tracks how your [new-client offer](/programmes/new-client-offer) is performing — the offers new clients redeem on their first visit and the discount value those redemptions give. Available on plans that include messaging; the new-client offer itself is part of Messages Plus.
### Filter Options
* **Date range** — The period for which new-client offer data should be displayed.
* **Comparison** — Compare against the previous period or the same period last year. When enabled, delta indicators (green/red arrows with percentage change) appear on the redemptions and offer value.
### Data Fields
* **Date** — The date for the new-client offer activity.
* **Offers redeemed** — The number of new-client offers redeemed at checkout on that date.
* **Offer value** — The total discount applied by the new-client offers redeemed on that date.
***
## Tips summary report
The **Tips summary** report shows tips received by your team members over time. You can view tips aggregated by date or broken down by team member, making it easy to track gratuity trends.
### Filter Options
* **Date range** — The period for which tip data should be displayed.
* **Team members** — Multi-select to filter by specific team members.
* **Comparison** — Compare against the previous period or same period last year.
* **Group by** — Switch between two display modes:
* **By date** (default) — One row per day across the selected period. All dates are shown, including days with zero tips.
* **By team member** — One row per team member. Expand any row to see a day-by-day breakdown for that person.
### Data Fields — By date
* **Date** — The local date.
* **Tip count** — The number of tips received on that date.
* **Total tips** — The total monetary value of tips received on that date.
* **Average tip** — The average tip amount per transaction on that date (Total tips ÷ Tip count).
### Data Fields — By team member
* **Team member** — The name of the team member.
* **Tip count** — The total number of tips received by this team member in the selected period.
* **Total tips** — The total monetary value of tips received by this team member.
* **Average tip** — The average tip amount per transaction (Total tips ÷ Tip count).
Expanding a team member row reveals a daily breakdown with the same Date, Tip count, Total tips, and Average tip columns for each day in the range.
***
## Packages summary report
The **Packages summary** report tracks prepaid package sales, redemptions, and outstanding sessions over time. Available on plans that include packages.
### Filter Options
* **Date range** — The period for which package data should be displayed.
* **Comparison** — Compare against the previous period or same period last year.
### Data Fields
* **Date** — The date for the package activity.
* **Packages sold** — The number of packages sold on that date.
* **Total sold amount** — The total monetary value of packages sold.
* **Sessions redeemed** — The number of sessions redeemed on that date.
* **Sessions outstanding** — Sessions sold but not yet redeemed, as of that date — the balance you still owe clients.
***
## Membership summary report
The **Membership summary** report tracks membership performance over time — new memberships sold, new-membership revenue, cancellations, sessions redeemed, and the total active member base. Available on plans that include memberships.
### Filter Options
* **Date range** — The period for which daily sales data should be displayed.
* **Team members** — Multi-select to filter by specific team members.
* **Comparison** — Compare against the previous period or same period last year.
### Data Fields
* **Date** — The sale date (the calendar day the sale was rung, or the day your team set as the sale date). This is not the appointment date — if you check out an appointment the day after it happened, revenue lands here on the checkout/sale date unless you change **Sale date** at checkout or via **Edit sale**.
* **# of sales** — The total number of unique sales transactions completed on that date.
* **# services** — The total count of individual service items sold on that date.
* **Services sales** — The total revenue generated from service sales on that date.
* **# products** — The total count of individual product items sold on that date.
* **Products sales** — The total revenue generated from product sales on that date.
* **# custom items** — The total count of custom (one-off) items sold on that date.
* **Custom items sales** — The total revenue from those custom items.
* **Refunds** — The total value of refunds processed on that date.
* **Total sales** — The net sales value (services + products + custom items − refunds).
* **Cash** — Total payments received in cash.
* **Card** — Total payments received by credit/debit card (including card on file).
* **Gift card** — Total payments received via gift card redemptions.
* **Client credit** — Total payments taken from clients' stored-value credit balances.
* **Other** — Any remaining tenders (e.g. package redemptions), so the payment breakdown always adds up to the total.
**How deposits are counted.** An appointment deposit is attributed to the method it was actually taken with — a card deposit lands in **Card**, a cash deposit in **Cash** — separately from whatever settled the remaining balance. So a $180 appointment with a $43 card deposit finished in cash reports $43 of card and $137 of cash, which is what your card statement and your till will show. Deposits are counted on the **checkout date**, not the day the client paid the deposit. Appointments checked out before August 2026 include the deposit in the tender that settled the balance, so earlier periods keep the figures you have already reported on.
* **Discounts** — Total discounts applied to sales (loyalty rewards and manual discounts).
***
## Future income report
The **Future income** report shows the expected income from your **upcoming, not-yet-completed appointments** — your booked pipeline — **net of any manual and promo-code discounts** already applied. It answers "how much have I actually got on the books?" without waiting for checkout. It counts appointments with a **Booked** or **Confirmed** status that fall in the window you choose; completed and cancelled appointments (including no-shows) are excluded.
> **What's included:** the figure is net of the **manual discounts and promo codes** already on each appointment. Memberships, packages, loyalty rewards and gift cards are only applied at checkout, so they are **not** deducted here — the final amount collected may be lower for a client who redeems one. Tips and taxes aren't included either, as they're added at checkout.
### Filter Options
* **Date range** — A forward window with quick presets for **Next 7 days**, **Next 30 days**, **Next 90 days** (the default) and **Next month**, plus any custom range.
* **Team members** — Multi-select to filter by specific team members.
* **Resources** — Multi-select to filter by specific resources (rooms/equipment).
### Summary
* **Expected net income** — Gross booked value less manual and promo-code discounts, across all matching appointments.
* **Gross booked** — The total booked value before discounts.
* **Discounts** — The total manual and promo-code discounts applied. A percentage of gross is also shown once you have enough upcoming appointments for it to be meaningful.
* **Deposits held** — Deposits already collected against these appointments.
* **Balance to collect** — Expected net income less deposits already held.
A trend chart shows expected net income across the window, grouped by day, week or month depending on how far ahead you're looking.
### Data Fields (by team member / resource)
* **Team member / resource** — The name of the team member or resource. Resource rows are labelled *(resource)*.
* **Appointments** — The number of upcoming appointments they're part of.
* **Gross** — The booked value of their services before discounts.
* **Discounts** — Their share of the manual and promo-code discounts.
* **Net** — Gross less discounts.
### Use Cases
* Track the income you have booked for the weeks ahead and plan cash flow.
* See how discounts and promo codes are affecting your forward revenue.
* Spot quiet weeks early so you can promote them before they arrive.
***
## Service & product sales report
The **Service & product sales** report provides a comprehensive view of sales performance broken down by team member, showing both service and product sales separately with percentage splits.
### Filter Options
* **Date range** — The period for which sales data should be displayed.
* **Team members** — Multi-select to filter by specific team members.
* **Comparison** — Compare against the previous period or same period last year.
### Data Fields
* **Team member** — The name of the team member.
* **# of services** — The total count of individual service items sold by the team member.
* **Service sales** — The total revenue generated from service sales by the team member.
* **# products** — The total count of individual product items sold by the team member.
* **Product sales** — The total revenue generated from product sales by the team member.
* **Total sales** — The combined revenue from both services and products.
* **Service %** — The percentage of total sales from services.
* **Product %** — The percentage of total sales from products.
***
## Service bookings report
The **Service bookings** report shows how many times each service was **booked** — counted from appointment service lines by **appointment date**, excluding cancelled appointments. Use this when you want popularity by bookings, including appointments that have not been checked out yet.
This is **not** the same as [Services sales](#services-sales-report), which counts services **sold at checkout**.
### Filter Options
* **Date range** — Filters on the **appointment date** (the day the appointment is scheduled for).
* **Team members** — Multi-select to focus on specific team members (matches the team member on each service line).
* **Resources** — Multi-select to focus on specific resources (matches the resource on each service line). Lines may have a team member, a resource, or both.
* **Comparison** — Compare against the previous period or same period last year.
### Data Fields
* **Service name** — The name of the individual service.
* **Service category** — The category that this service belongs to.
* **# bookings** — The number of non-cancelled appointment service lines for this service. A multi-service appointment contributes one count per service line. Bundle components each count as their own line. Variants of the same service are rolled into that service.
* **% of bookings** — This service’s share of all booking lines in the period.
* **Avg duration (mins)** — The average booked duration in minutes for this service’s lines.
***
## Services sales report
The **Services sales** report provides detailed insights into the performance of individual services **at checkout**, including pricing, revenue share, and duration metrics.
The date filter uses the **checkout date** (when the sale was completed), not the appointment date. Appointments that were booked but never checked out do not appear here. For booking counts by appointment date, use [Service bookings](#service-bookings-report).
The report has two views: **Summary** (one row per service, aggregated over the period) and **Detailed** (one row per service sold, with dates — handy for exporting CSVs into bookkeeping or cashflow spreadsheets).
### Filter Options
* **Date range** — The period of **checkout dates** to include.
* **Team members** — Multi-select to filter by specific team members.
* **Comparison** — Compare against the previous period or same period last year. Available in the Summary view only — the Detailed view lists individual lines, so there is nothing to compare period-on-period.
### Data Fields
* **Service name** — The name of the individual service.
* **Service category** — The category that this service belongs to.
* **# services** — The total number of times this service was **sold** at checkout.
* **Sales** — The total revenue generated from this service, net of any refunds.
* **Avg price** — The average price per service instance.
* **% of revenue** — The percentage of total service revenue represented by this service.
* **Avg duration (mins)** — The average duration in minutes for this service.
### Data Fields (Detailed view)
* **Date of service** — The date the service was performed (the appointment date; for walk-in sales, the checkout date).
* **Checkout date** — The date the sale was checked out.
* **Service** — The service name (including the variant, where applicable).
* **Bundle** — The bundle this line was sold as part of, or a dash when the service was sold on its own. A bundle is sold as one line per component service, so each component keeps its own row.
* **Service category** — The category that this service belongs to.
* **Team member** — Who performed the service.
* **Gross** — The price charged on the sale for that line, before any per-service discount or refund. Where a package session covered the service, the covered portion is already taken off.
* **Net** — Gross less that line's share of any per-service membership or manual discount, and less its share of any refund. This is the figure that reconciles with the Summary view's Sales total.
***
## Products sales report
The **Products sales** report provides detailed insights into retail product performance, showing which products are selling well, their average price, and revenue share.
### Filter Options
* **Date range** — The period for which product sales data should be displayed.
* **Team members** — Multi-select to filter by specific team members.
* **Comparison** — Compare against the previous period or same period last year.
### Data Fields
* **Product** — The name of the retail product.
* **# products** — The total quantity of this product sold.
* **Sales** — The total revenue generated from this product.
* **Avg price** — The average price per unit sold.
* **% of revenue** — The percentage of total product revenue represented by this product.
***
## Team member sales report
The **Team member sales** report provides comprehensive sales performance metrics for each team member, including productivity measures like service hours and sales per hour.
### Filter Options
* **Date range** — The period for which team member sales data should be displayed.
* **Team members** — Multi-select to filter by specific team members.
* **Comparison** — Compare against the previous period or same period last year.
### Data Fields
* **Team member** — The name of the team member.
* **# of sales** — The total number of unique sales that include items attributed to this team member.
* **Total sales** — The total revenue from all items attributed to this team member.
* **Avg services per sale** — The average number of service items per sale.
* **Avg products per sale** — The average number of product items per sale.
* **Average sale value** — The average value of items per sale (Total sales / # of sales).
* **Service hours** — The total hours of services delivered by the team member.
* **Sales per hour** — Revenue generated per service hour (Total sales / Service hours).
***
## Utilisation report
The **Utilisation** report provides insights into how effectively your team members' available working hours are being utilised, including revenue metrics.
### Filter Options
* **Date range** — The period for which utilisation data should be displayed.
* **Team members** — Multi-select to filter by specific team members.
* **Comparison** — Compare against the previous period or same period last year.
### Data Fields
* **Team member** — The name of the team member.
* **Available hours** — The total hours the team member was scheduled to work, excluding time off and blocked time.
* **Booked** — The total hours booked with client appointments.
* **Unbooked** — The available hours not booked (Available hours − Booked).
* **% utilisation** — The percentage of available hours that were booked (Booked / Available hours × 100).
* **Revenue** — The total sales revenue generated by the team member during the period.
* **Revenue per hour** — Revenue divided by booked hours (Revenue / Booked).
***
## Days off report
The **Days off** report provides a detailed listing of all scheduled time off for your team members, including the duration and hours impact.
### Filter Options
* **Date range** — The period for which time-off data should be displayed.
* **Team members** — Multi-select to filter by specific team members.
### Data Fields
* **Team member** — The name of the team member who has scheduled time off.
* **Day** — The specific date of the time off.
* **Type** — The type of time off.
* **Total days off** — The total number of days off for this team member in the selected period.
* **Hours missed** — The total working hours missed due to the time off, based on the team member's scheduled working hours.
***
## Client retention report
The **Client retention** report tracks new versus returning clients and rebooking rates by team member and resource, helping you measure client loyalty and identify retention opportunities.
### Filter Options
* **Date range** — The period for which retention data should be displayed.
* **Team members** — Multi-select to filter by specific team members.
* **Resources** — Multi-select to filter by specific resources (rooms/equipment).
* **Comparison** — Compare against the previous period or same period last year.
### Data Fields
* **Team member / resource** — The name of the team member or resource. Resource rows are labelled *(resource)*.
* **Total clients** — The total number of unique clients served by that team member or resource.
* **New clients** — Clients who had their first-ever appointment during the selected period.
* **Returning clients** — Clients who had previous appointments before the selected period.
* **Retention rate (%)** — The percentage of clients who are returning (Returning clients / Total clients × 100).
* **Rebooking rate (%)** — The percentage of clients who have a future appointment booked at the time of viewing.
***
## Booking source report
The **Booking source** report shows where your bookings come from, helping you understand the effectiveness of your online booking page versus manual bookings.
This report tracks the booking **origin** — whether an appointment was created by the client online, by your team on the dashboard, or through your own website integration. That's different from the traffic **channel** (Instagram, Google, an AI assistant, and so on) that sends a visitor to your booking page, which you'll find under [Online booking analytics](/online-booking/analytics).
### Filter Options
* **Date range** — The period for which booking source data should be displayed.
* **Comparison** — Compare against the previous period or same period last year.
### Data Fields
* **Source** — The booking origin: **Online** (the client booked themselves), **Team Booking** (someone on your team booked it on the dashboard — including appointments imported from a previous system), or **Integration** (created through your own API key — typically a booking form on your own website). Appointments created before Bella tracked booking origins appear as **Unknown**.
* **Appointments** — The total number of appointments from this source.
* **Revenue** — The total revenue generated from appointments booked through this source.
* **% of total** — The percentage of all appointments represented by this source.
* **Average value** — The average revenue per appointment from this source.
***
## Gift card summary report
The **Gift card summary** report tracks gift card sales (including cash / card / other / online amounts collected), redemptions, and outstanding balances over time. Use it to reconcile till payments taken for gift cards. Available on plans that include gift cards.
### Filter Options
* **Date range** — The period for which gift card data should be displayed.
* **Comparison** — Compare against the previous period or same period last year.
### Data Fields
* **Date** — The date for the gift card activity.
* **Gift cards sold** — The number of gift cards sold on that date.
* **Total sold amount** — The total monetary value of gift cards sold.
* **Gift cards redeemed** — The number of gift cards that had redemptions on that date.
* **Total redeemed amount** — The total monetary value redeemed from gift cards.
* **Outstanding balance** — The remaining unredeemed balance across all gift cards as of that date.
***
## Client credit summary report
The **Client credit summary** report shows your total outstanding [Client credit](/client-credit) (stored-value) liability **right now** — it's a point-in-time snapshot, not a date range. Available on plans that include client credit. Use it for reconciliation and to see exactly how much stored value you owe clients.
### Data Fields
* **Client** — Each client currently holding a balance (searchable; export to CSV for reconciliation).
* **Balance** — The client's total spendable credit.
* **Paid** — The portion that is the client's own money (top-ups and refunds-to-credit).
* **Bonus** — The promotional-bonus portion, kept separate so your true liability is clear.
* **Currency** — The currency the balance is held in (a client's balance is locked to one currency).
Per-currency totals are summarised at the top. A **Reconcile balances** button checks each cached balance against its transaction ledger. If any have drifted, team members with the **Client Credit → Manage client credit** permission also get a **Repair** action that rewrites the drifted balances from the ledger.
***
## Loyalty summary report
The **Loyalty summary** report monitors loyalty programme activity including points earned, redeemed, and expired. Available on plans that include the loyalty programme.
### Filter Options
* **Date range** — The period for which loyalty data should be displayed.
* **Comparison** — Compare against the previous period or same period last year.
### Data Fields
* **Date** — The date for the loyalty activity.
* **Points earned** — The total loyalty points earned by clients on that date.
* **Points redeemed** — The total loyalty points redeemed by clients on that date.
* **Points expired** — The total loyalty points that expired on that date.
* **Rewards redeemed** — The number of loyalty rewards claimed on that date.
* **Active members** — The number of clients with a non-zero points balance as of that date.
***
## Referrals report
The **Referrals** report tracks how your referral programme is performing day by day — successful referrals, the rewards they generate, and the value of the discounts clients redeem. Available on plans that include loyalty/referrals — see [Referrals](/programmes/referrals).
### Filter Options
* **Date range** — The period for which referral data should be displayed.
* **Comparison** — Compare against the previous period or same period last year.
### Data Fields
* **Date** — The date for the referral activity.
* **Conversions** — The number of successful referrals on that date. A conversion is counted when a referred friend completes their first paid visit and the referrer earns their reward.
* **Rewards issued** — The number of referral rewards created on that date, counting both the referred friend's welcome reward and the referrer's earned reward.
* **Redeemed** — The number of referral rewards redeemed at checkout on that date. A reward issued on an earlier date may be redeemed within the selected range, so the issued and redeemed counts on a single row need not match.
* **Reward value** — The total discount applied by the referral rewards redeemed on that date.
***
## Birthday rewards report
The **Birthday rewards** report tracks how your [birthday reward](/programmes/birthday) is performing — the birthday rewards clients redeem at checkout and the discount value those redemptions give. Available on plans that include messaging; the birthday reward itself is part of Messages Plus.
> **Snapshot:** At the top of the report, a callout shows how many clients have a birthday in the current month and the percentage of your active clients who have a date of birth on file. These are current totals — they do not change with the date range, so you can gauge how complete your birthday data is and how many clients are eligible this month. Only the table below follows the selected dates.
### Filter Options
* **Date range** — The period for which birthday reward data should be displayed. The snapshot callout above is independent of this range.
* **Comparison** — Compare against the previous period or same period last year. The comparison applies only to the rewards redeemed and reward value, not to the current snapshot.
### Data Fields
* **Date** — The date for the birthday reward activity.
* **Rewards redeemed** — The number of birthday rewards redeemed at checkout on that date.
* **Reward value** — The total discount applied by the birthday rewards redeemed on that date.
***
## New client offers report
The **New client offers** report tracks how your [new-client offer](/programmes/new-client-offer) is performing — the offers new clients redeem on their first visit and the discount value those redemptions give. Available on plans that include messaging; the new-client offer itself is part of Messages Plus.
### Filter Options
* **Date range** — The period for which new-client offer data should be displayed.
* **Comparison** — Compare against the previous period or the same period last year. When enabled, delta indicators (green/red arrows with percentage change) appear on the redemptions and offer value.
### Data Fields
* **Date** — The date for the new-client offer activity.
* **Offers redeemed** — The number of new-client offers redeemed at checkout on that date.
* **Offer value** — The total discount applied by the new-client offers redeemed on that date.
***
## Tips summary report
The **Tips summary** report shows tips received by your team members over time. You can view tips aggregated by date or broken down by team member, making it easy to track gratuity trends.
### Filter Options
* **Date range** — The period for which tip data should be displayed.
* **Team members** — Multi-select to filter by specific team members.
* **Comparison** — Compare against the previous period or same period last year.
* **Group by** — Switch between two display modes:
* **By date** (default) — One row per day across the selected period. All dates are shown, including days with zero tips.
* **By team member** — One row per team member. Expand any row to see a day-by-day breakdown for that person.
### Data Fields — By date
* **Date** — The local date.
* **Tip count** — The number of tips received on that date.
* **Total tips** — The total monetary value of tips received on that date.
* **Average tip** — The average tip amount per transaction on that date (Total tips ÷ Tip count).
### Data Fields — By team member
* **Team member** — The name of the team member.
* **Tip count** — The total number of tips received by this team member in the selected period.
* **Total tips** — The total monetary value of tips received by this team member.
* **Average tip** — The average tip amount per transaction (Total tips ÷ Tip count).
Expanding a team member row reveals a daily breakdown with the same Date, Tip count, Total tips, and Average tip columns for each day in the range.
***
## Packages summary report
The **Packages summary** report tracks prepaid package sales, redemptions, and outstanding sessions over time. Available on plans that include packages.
### Filter Options
* **Date range** — The period for which package data should be displayed.
* **Comparison** — Compare against the previous period or same period last year.
### Data Fields
* **Date** — The date for the package activity.
* **Packages sold** — The number of packages sold on that date.
* **Total sold amount** — The total monetary value of packages sold.
* **Sessions redeemed** — The number of sessions redeemed on that date.
* **Sessions outstanding** — Sessions sold but not yet redeemed, as of that date — the balance you still owe clients.
***
## Membership summary report
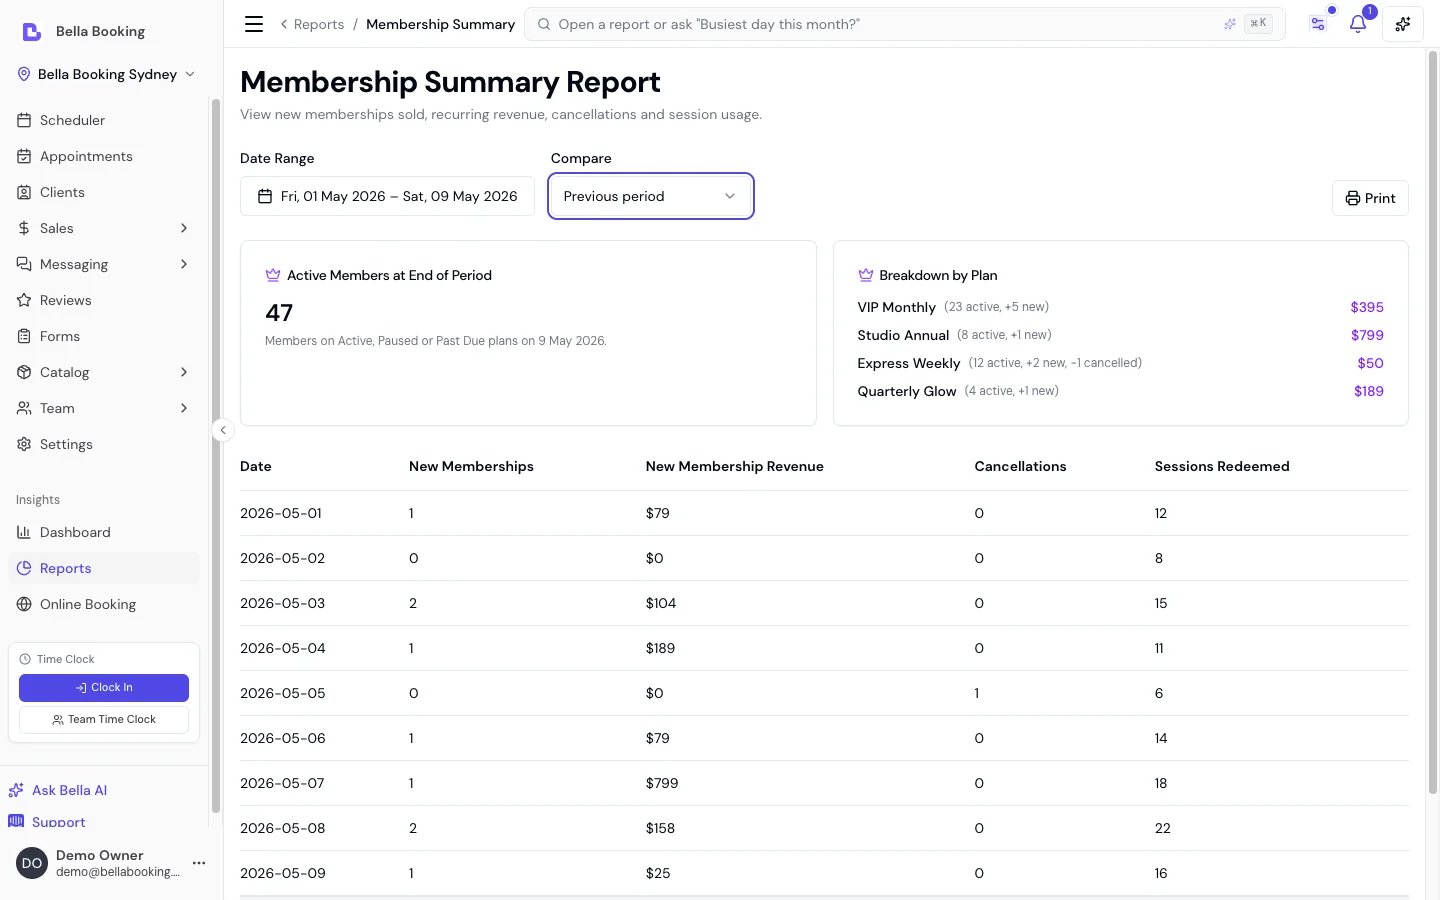
The **Membership summary** report tracks membership performance over time — new memberships sold, new-membership revenue, cancellations, sessions redeemed, and the total active member base. Available on plans that include memberships.
 ### Filter Options
* **Date range** — The period for which membership activity should be displayed.
* **Comparison** — Compare against the previous period or the same period last year.
### Summary Cards
* **Active members at end of period** — The number of members on Active, Paused or Past due plans on the last day of the selected range. Cancelled, expired and never-activated memberships are excluded.
* **Breakdown by plan** — For each plan with activity in the period, the active member count, new memberships sold, cancellations, and new membership revenue.
### Data Fields
* **Date** — The date for the membership activity.
* **New memberships** — The number of memberships activated on that date.
* **New membership revenue** — The first-payment revenue from memberships activated on that date.
* **Cancellations** — The number of memberships cancelled or expired on that date.
* **Sessions redeemed** — The number of session-based benefit redemptions on that date.
You can export the report as CSV. For details on creating and managing plans, see [Memberships](/memberships).
***
## At-risk clients report
The **At-risk clients** report identifies clients who may be at risk of not returning, based on how often they normally come in. If a client usually books every 4 weeks but hasn't been in for 6, they are flagged as overdue.
There is no date range on this report — it reads each client's full appointment history, so it always reflects where things stand today.
### Data Fields
* **Client** — The client's name, linked to their profile.
* **Email** — The client's email address, so you can reach out without leaving the report.
* **Appointments** — How many appointments the client has had in total.
* **Usual frequency** — The client's average number of days between appointments, calculated from their appointment history.
* **Days since last** — Days since the client's most recent appointment. Amber from 30 days, red from 60.
* **Overdue** — How many times over their usual gap the client now is (for example, 2× means twice their normal interval). Amber from 2×, red from 5×.
* **Lifetime spend** — The client's total spend across all their sales.
The client's phone number is included in the CSV export as well.
### How It Works
The report analyses each client's appointment history to work out their typical gap between appointments. Cancelled appointments are excluded, and so are appointments already booked for a future date — otherwise a single upcoming booking would hide a client who has genuinely drifted away. A client is flagged as at risk when they have had **at least two appointments**, it has been **at least 14 days** since their last one, and they are **at least 1.5×** past their usual gap. The 14-day floor stops frequent clients being flagged the moment they're a day late.
Clients are listed highest lifetime spend first, so the most valuable at-risk clients are at the top. The totals row shows how many clients are at risk and the combined spend at stake.
***
## Client lifetime value report
The **Client lifetime value** report projects the annual value of each client based on their appointment history, helping you understand which clients contribute most to your revenue.
There is no date range on this report — it reads each client's full history so the projection has as much to work with as possible.
### Data Fields
* **Client** — The client's name, linked to their profile.
* **Appointments** — The client's total number of appointments.
* **Total spend** — The total revenue generated from this client's sales.
* **Avg appt value** — The average revenue per appointment (Total spend ÷ Appointments).
* **First appointment** — The date of the client's first appointment.
* **Last appointment** — The date of the client's most recent appointment.
* **Predicted annual** — The projected yearly revenue: average appointment value × how many appointments a year the client's history suggests. A client with only one appointment has no established frequency yet, so this shows as zero until they come back.
***
## Top spenders report
The **Top spenders** report ranks clients by their total spending, helping you identify your most valuable clients for loyalty programmes, VIP treatment, and retention strategies.
### Filter Options
* **Date range** — The period for which spending data should be displayed.
* **Comparison** — Compare against the previous period or same period last year.
### Data Fields
* **Client** — The client's name, linked to their profile.
* **Appointments** — The number of appointments in the selected period.
* **Total spend** — The total revenue from this client in the selected period.
* **Avg spend / appt** — The average revenue per appointment.
* **Last appointment** — The date of the client's most recent appointment.
You can sort by any column. By default, clients are sorted by total spend (highest first).
***
## Discount summary report
The **Discount summary** report tracks manual and promo-code discount usage across your sales, by date and reason.
### Filter Options
* **Date range** — The period for which discount data should be displayed.
* **Comparison** — Compare against the previous period or same period last year.
### Data Fields
* **Date** — The date the discounts were applied.
* **Discount reason** — The reason or label applied to the discount (e.g. "Loyalty reward", "Manager override", "First visit").
* **Times applied** — The number of times this discount reason was applied on that date.
* **Total amount** — The total monetary value of those discounts.
### Use Cases
* Identify which discount reasons are used most frequently
* Track the financial impact of your discount policies
* Compare discount trends across periods to spot changes in discounting behaviour
***
## Attendance report
The **Attendance** report shows team member clock-in and clock-out records against their scheduled shifts. Unlike the other reports it isn't a single table — it's a card per day, per team member, so you can see what was scheduled, what was actually worked, and where the two don't match. It only appears once attendance tracking is switched on in your scheduling settings.
### Filter Options
* **Date range** — The period for which attendance data should be displayed. Defaults to the current week, with a **This week** button to jump back to it.
* **Team member** — Pick one team member, or leave it on all.
* **Status** — Narrow to **On time**, **Late**, **Missing** or **Active** days.
### Summary
Six cards sit above the day cards, covering everything that matches your filters:
* **Total worked** — Total hours actually clocked.
* **Total scheduled** — Total hours the team was rostered on.
* **Break time** — Total time clocked out on breaks.
* **Late arrivals** — The number of days a team member clocked in after their scheduled start.
* **Missing** — The number of scheduled shifts with no clock-in recorded at all.
* **Estimated pay** — Hours worked costed at each team member's hourly rate. Team members without an hourly rate on their profile contribute nothing to this figure.
### Day Cards
Each card covers one team member on one day and is labelled **On time**, **Late**, **Missing**, **Active** (still clocked in) or **No shift**. It shows the scheduled shift, hours worked and earnings for the day, with a banner spelling out how late a late clock-in was, or that a scheduled shift had no clock-in.
Underneath, each individual time entry lists its clock-in → clock-out time range, duration and earnings, tagged where relevant as **Manual** (added by hand), **Auto-closed** (never clocked out) or **Edited** (hover to see who changed it and when). You can add, edit, close or delete entries straight from the report.
The **Export CSV** button gives you the flat version of all this — one row per entry, with team member, date, scheduled shift, clock-in and clock-out, total hours, hourly rate, estimated pay and status — which is the format to hand to payroll.
***
## Peak hours report
The **Peak hours** report shows your busiest times across the week as a visual heatmap, helping you optimise staffing, promotions, and availability.
### Filter Options
* **Date range** — The period for which appointment data should be analysed.
### How It Works
The report builds a **7×14 heatmap** (Monday–Sunday × 7am–8pm) showing the number of appointments at each hour of each day. Darker cells indicate busier times. The report also identifies your **busiest 2-hour window** across the entire week.
### Data Fields
* **Heatmap** — A grid showing appointment count per day and hour, colour-coded from light (fewer appointments) to dark (more appointments).
* **Busiest slot** — The peak 2-hour window with the highest combined appointment count (e.g., "Tue 10am–12pm").
* **Total appointments** — The total number of non-cancelled appointments in the selected period. This counts every appointment, including any starting before 7am or from 9pm onwards, so it can be higher than the heatmap cells add up to.
### Use Cases
* **Staffing**: Schedule more team members during peak hours and reduce coverage during quiet times.
* **Promotions**: Offer discounts during off-peak hours to balance your schedule.
* **Availability**: Extend or reduce online booking availability based on demand patterns.
***
## FAQs
**Q: Can I export reports to CSV?**
A: Yes — every report has an **Export CSV** button except **Online booking analytics**, which is a multi-section funnel view rather than a single table, so there are no rows to export. The export contains all matching records (not just the current page) with formatted values. You can open CSV files in Excel or Google Sheets.
**Q: How do I compare performance across periods?**
A: Many reports include a **Comparison** toggle. Select "Previous period" to compare against the same number of days immediately before your selected range, or "Same period last year" to compare against the equivalent dates one year ago. When enabled, delta indicators (green/red arrows) appear on numeric columns.
**Q: How do I schedule reports to run automatically?**
A: Automatic report scheduling is not currently available. You manually generate reports as needed.
**Q: Why don't I see the Reports section?**
A: Reports access requires the **Reports → View all reports** permission. By default, Owners and Admins have it. Your account owner can grant report access to any role through **Settings → Team permissions**. (A team member with only **Timesheets → Manage timesheets**, on a business with attendance tracking switched on, sees the Reports page too — but nothing on it except the Attendance report.)
**Q: How far back does report data go?**
A: Reports can access all historical data from when you started using Bella Booking.
**Q: Do reports update in real-time?**
A: Reports show data up to the current time when you load them. Refresh the page to see the latest data.
**Q: Can clients see any reports?**
A: No. Reports are internal business tools not accessible to clients.
**Q: Why is a report locked?**
A: That report isn't part of your current plan. Locked reports stay listed so you can see what's available — click one and you'll get an upgrade prompt telling you what it needs. Gift card summary, Client credit summary, Loyalty summary, Packages summary and Membership summary each need their matching feature; **Referrals** unlocks with Loyalty, and [Birthday rewards](/programmes/birthday) and [New client offers](/programmes/new-client-offer) need a plan that includes messaging. The advanced reports (Service & product sales, Team member sales, Utilisation, Client retention, Client lifetime value, At-risk clients, Top spenders, Booking source, Peak hours, Tips summary) need a plan with advanced reports. Every report also requires the **Reports → View all reports** permission — see the question above.
**Q: Why don't I see the Attendance report?**
A: Attendance is the one report hidden rather than locked. It appears once attendance tracking is switched on in your scheduling settings, and it needs the **Timesheets → Manage timesheets** permission rather than **Reports → View all reports**.
***
**Note:** Reports provide the detailed data you need for informed decision-making. Use them alongside the Dashboard for comprehensive business oversight.
### Filter Options
* **Date range** — The period for which membership activity should be displayed.
* **Comparison** — Compare against the previous period or the same period last year.
### Summary Cards
* **Active members at end of period** — The number of members on Active, Paused or Past due plans on the last day of the selected range. Cancelled, expired and never-activated memberships are excluded.
* **Breakdown by plan** — For each plan with activity in the period, the active member count, new memberships sold, cancellations, and new membership revenue.
### Data Fields
* **Date** — The date for the membership activity.
* **New memberships** — The number of memberships activated on that date.
* **New membership revenue** — The first-payment revenue from memberships activated on that date.
* **Cancellations** — The number of memberships cancelled or expired on that date.
* **Sessions redeemed** — The number of session-based benefit redemptions on that date.
You can export the report as CSV. For details on creating and managing plans, see [Memberships](/memberships).
***
## At-risk clients report
The **At-risk clients** report identifies clients who may be at risk of not returning, based on how often they normally come in. If a client usually books every 4 weeks but hasn't been in for 6, they are flagged as overdue.
There is no date range on this report — it reads each client's full appointment history, so it always reflects where things stand today.
### Data Fields
* **Client** — The client's name, linked to their profile.
* **Email** — The client's email address, so you can reach out without leaving the report.
* **Appointments** — How many appointments the client has had in total.
* **Usual frequency** — The client's average number of days between appointments, calculated from their appointment history.
* **Days since last** — Days since the client's most recent appointment. Amber from 30 days, red from 60.
* **Overdue** — How many times over their usual gap the client now is (for example, 2× means twice their normal interval). Amber from 2×, red from 5×.
* **Lifetime spend** — The client's total spend across all their sales.
The client's phone number is included in the CSV export as well.
### How It Works
The report analyses each client's appointment history to work out their typical gap between appointments. Cancelled appointments are excluded, and so are appointments already booked for a future date — otherwise a single upcoming booking would hide a client who has genuinely drifted away. A client is flagged as at risk when they have had **at least two appointments**, it has been **at least 14 days** since their last one, and they are **at least 1.5×** past their usual gap. The 14-day floor stops frequent clients being flagged the moment they're a day late.
Clients are listed highest lifetime spend first, so the most valuable at-risk clients are at the top. The totals row shows how many clients are at risk and the combined spend at stake.
***
## Client lifetime value report
The **Client lifetime value** report projects the annual value of each client based on their appointment history, helping you understand which clients contribute most to your revenue.
There is no date range on this report — it reads each client's full history so the projection has as much to work with as possible.
### Data Fields
* **Client** — The client's name, linked to their profile.
* **Appointments** — The client's total number of appointments.
* **Total spend** — The total revenue generated from this client's sales.
* **Avg appt value** — The average revenue per appointment (Total spend ÷ Appointments).
* **First appointment** — The date of the client's first appointment.
* **Last appointment** — The date of the client's most recent appointment.
* **Predicted annual** — The projected yearly revenue: average appointment value × how many appointments a year the client's history suggests. A client with only one appointment has no established frequency yet, so this shows as zero until they come back.
***
## Top spenders report
The **Top spenders** report ranks clients by their total spending, helping you identify your most valuable clients for loyalty programmes, VIP treatment, and retention strategies.
### Filter Options
* **Date range** — The period for which spending data should be displayed.
* **Comparison** — Compare against the previous period or same period last year.
### Data Fields
* **Client** — The client's name, linked to their profile.
* **Appointments** — The number of appointments in the selected period.
* **Total spend** — The total revenue from this client in the selected period.
* **Avg spend / appt** — The average revenue per appointment.
* **Last appointment** — The date of the client's most recent appointment.
You can sort by any column. By default, clients are sorted by total spend (highest first).
***
## Discount summary report
The **Discount summary** report tracks manual and promo-code discount usage across your sales, by date and reason.
### Filter Options
* **Date range** — The period for which discount data should be displayed.
* **Comparison** — Compare against the previous period or same period last year.
### Data Fields
* **Date** — The date the discounts were applied.
* **Discount reason** — The reason or label applied to the discount (e.g. "Loyalty reward", "Manager override", "First visit").
* **Times applied** — The number of times this discount reason was applied on that date.
* **Total amount** — The total monetary value of those discounts.
### Use Cases
* Identify which discount reasons are used most frequently
* Track the financial impact of your discount policies
* Compare discount trends across periods to spot changes in discounting behaviour
***
## Attendance report
The **Attendance** report shows team member clock-in and clock-out records against their scheduled shifts. Unlike the other reports it isn't a single table — it's a card per day, per team member, so you can see what was scheduled, what was actually worked, and where the two don't match. It only appears once attendance tracking is switched on in your scheduling settings.
### Filter Options
* **Date range** — The period for which attendance data should be displayed. Defaults to the current week, with a **This week** button to jump back to it.
* **Team member** — Pick one team member, or leave it on all.
* **Status** — Narrow to **On time**, **Late**, **Missing** or **Active** days.
### Summary
Six cards sit above the day cards, covering everything that matches your filters:
* **Total worked** — Total hours actually clocked.
* **Total scheduled** — Total hours the team was rostered on.
* **Break time** — Total time clocked out on breaks.
* **Late arrivals** — The number of days a team member clocked in after their scheduled start.
* **Missing** — The number of scheduled shifts with no clock-in recorded at all.
* **Estimated pay** — Hours worked costed at each team member's hourly rate. Team members without an hourly rate on their profile contribute nothing to this figure.
### Day Cards
Each card covers one team member on one day and is labelled **On time**, **Late**, **Missing**, **Active** (still clocked in) or **No shift**. It shows the scheduled shift, hours worked and earnings for the day, with a banner spelling out how late a late clock-in was, or that a scheduled shift had no clock-in.
Underneath, each individual time entry lists its clock-in → clock-out time range, duration and earnings, tagged where relevant as **Manual** (added by hand), **Auto-closed** (never clocked out) or **Edited** (hover to see who changed it and when). You can add, edit, close or delete entries straight from the report.
The **Export CSV** button gives you the flat version of all this — one row per entry, with team member, date, scheduled shift, clock-in and clock-out, total hours, hourly rate, estimated pay and status — which is the format to hand to payroll.
***
## Peak hours report
The **Peak hours** report shows your busiest times across the week as a visual heatmap, helping you optimise staffing, promotions, and availability.
### Filter Options
* **Date range** — The period for which appointment data should be analysed.
### How It Works
The report builds a **7×14 heatmap** (Monday–Sunday × 7am–8pm) showing the number of appointments at each hour of each day. Darker cells indicate busier times. The report also identifies your **busiest 2-hour window** across the entire week.
### Data Fields
* **Heatmap** — A grid showing appointment count per day and hour, colour-coded from light (fewer appointments) to dark (more appointments).
* **Busiest slot** — The peak 2-hour window with the highest combined appointment count (e.g., "Tue 10am–12pm").
* **Total appointments** — The total number of non-cancelled appointments in the selected period. This counts every appointment, including any starting before 7am or from 9pm onwards, so it can be higher than the heatmap cells add up to.
### Use Cases
* **Staffing**: Schedule more team members during peak hours and reduce coverage during quiet times.
* **Promotions**: Offer discounts during off-peak hours to balance your schedule.
* **Availability**: Extend or reduce online booking availability based on demand patterns.
***
## FAQs
**Q: Can I export reports to CSV?**
A: Yes — every report has an **Export CSV** button except **Online booking analytics**, which is a multi-section funnel view rather than a single table, so there are no rows to export. The export contains all matching records (not just the current page) with formatted values. You can open CSV files in Excel or Google Sheets.
**Q: How do I compare performance across periods?**
A: Many reports include a **Comparison** toggle. Select "Previous period" to compare against the same number of days immediately before your selected range, or "Same period last year" to compare against the equivalent dates one year ago. When enabled, delta indicators (green/red arrows) appear on numeric columns.
**Q: How do I schedule reports to run automatically?**
A: Automatic report scheduling is not currently available. You manually generate reports as needed.
**Q: Why don't I see the Reports section?**
A: Reports access requires the **Reports → View all reports** permission. By default, Owners and Admins have it. Your account owner can grant report access to any role through **Settings → Team permissions**. (A team member with only **Timesheets → Manage timesheets**, on a business with attendance tracking switched on, sees the Reports page too — but nothing on it except the Attendance report.)
**Q: How far back does report data go?**
A: Reports can access all historical data from when you started using Bella Booking.
**Q: Do reports update in real-time?**
A: Reports show data up to the current time when you load them. Refresh the page to see the latest data.
**Q: Can clients see any reports?**
A: No. Reports are internal business tools not accessible to clients.
**Q: Why is a report locked?**
A: That report isn't part of your current plan. Locked reports stay listed so you can see what's available — click one and you'll get an upgrade prompt telling you what it needs. Gift card summary, Client credit summary, Loyalty summary, Packages summary and Membership summary each need their matching feature; **Referrals** unlocks with Loyalty, and [Birthday rewards](/programmes/birthday) and [New client offers](/programmes/new-client-offer) need a plan that includes messaging. The advanced reports (Service & product sales, Team member sales, Utilisation, Client retention, Client lifetime value, At-risk clients, Top spenders, Booking source, Peak hours, Tips summary) need a plan with advanced reports. Every report also requires the **Reports → View all reports** permission — see the question above.
**Q: Why don't I see the Attendance report?**
A: Attendance is the one report hidden rather than locked. It appears once attendance tracking is switched on in your scheduling settings, and it needs the **Timesheets → Manage timesheets** permission rather than **Reports → View all reports**.
***
**Note:** Reports provide the detailed data you need for informed decision-making. Use them alongside the Dashboard for comprehensive business oversight.