Introduction
Your Online Booking page now shows analytics about how people use your booking page. Instead of only seeing how many clients booked, you can see where they come from and where they drop off on the way to booking — so you know exactly what to improve to win more bookings. Everything here is built in. There’s no Google Analytics to set up and no tracking code to paste — Bella measures booking-page activity automatically. If you’d also like your booking page to report into your own Google Analytics, Google Ads or Meta account — for example to measure ad campaigns — see Connect Your Own Analytics. That’s optional and separate from the built-in analytics on this page.Where to find it
- Open Online Booking from the main sidebar.
- The performance cards appear at the top of the page and are always visible.
- Below them, Detailed analytics is collapsed by default. Click it to reveal your booking funnel and traffic sources. Click Hide detailed analytics to collapse it again.
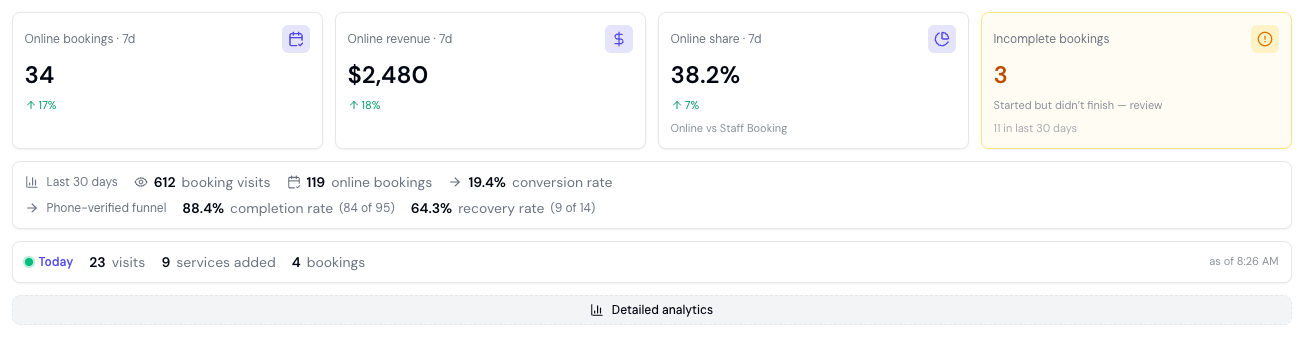
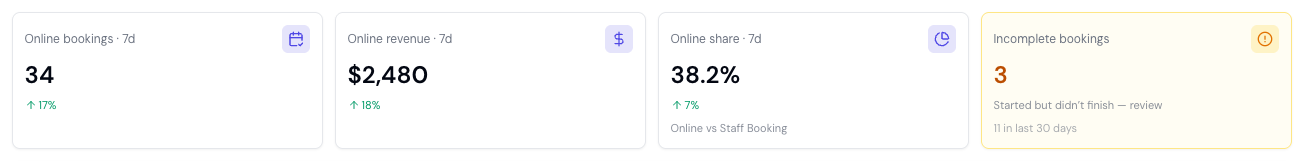
The performance cards
A row of cards at the top of the page summarises your recent online-booking performance. The first four cards cover the last 7 days:- Online bookings — The number of appointments clients booked themselves through your online booking page.
- Online revenue — The value of those online bookings.
- Online share — The percentage of bookings made online versus booked by your team on the dashboard (shown as “Online vs Team Booking”). System-generated appointments are excluded so the split reflects real client-versus-team behaviour.
- Incomplete bookings — Clients who started a booking but didn’t finish. When there’s something to follow up, this card turns amber and links you to the incomplete bookings list. See Incomplete Bookings for how to recover these.
- Booking visits — The number of distinct visitors to your booking page.
- Online bookings — The number of online bookings in the same period.
- Conversion rate — Of those booking visits, the percentage that resulted in a completed online booking. In plain terms: out of everyone who landed on your booking page, how many actually booked. A higher conversion rate means your booking page is doing its job.
Live activity today
When there’s activity on your booking page today, a live Today strip appears above the detailed analytics. It shows:- Visits — How many people visited your booking page today.
- Started — How many began a booking (added a service).
- Bookings — How many completed a booking today.
0.
This is handy right after you share your booking link — post it to Instagram, then watch the visits tick up.
Your booking funnel
Open Detailed analytics to see your Booking funnel, covering the last 30 days and counted by distinct visitors. The funnel shows how far visitors get through four steps on the way to booking:- Visited — Visitors who landed on your booking page.
- Added a service — Visitors who chose a service.
- Picked a time — Visitors who selected an appointment time.
- Booked — Visitors who completed their booking.
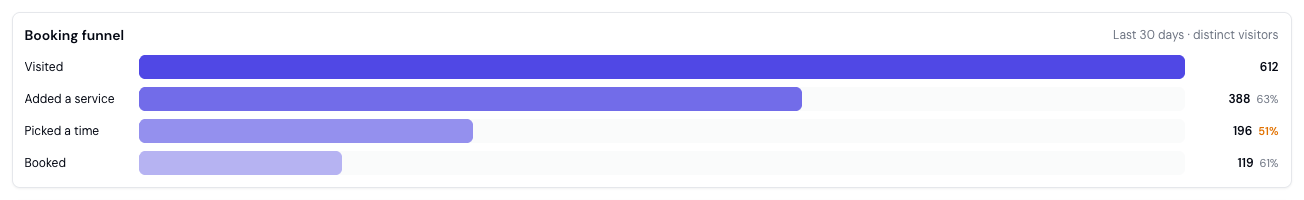
Reading the “Booked” step
The final Booked step shows the share of visitors who completed their booking, so you can see how the whole journey converts end to end. For the single headline figure, use the conversion rate in the performance cards above — it’s the most reliable measure of how many visits became bookings. The funnel itself is most useful for spotting where visitors drop away, so you can fix that step.Reading the funnel
- A big drop between “Visited” and “Added a service” suggests visitors aren’t finding a service they want, or your service list is hard to navigate. Review your service names, descriptions, and prices.
- A big drop between “Added a service” and “Picked a time” often means availability. If clients add a service but leave before picking a time, you may not have enough open slots — try widening your availability, adding hours, or freeing up more online-bookable time.
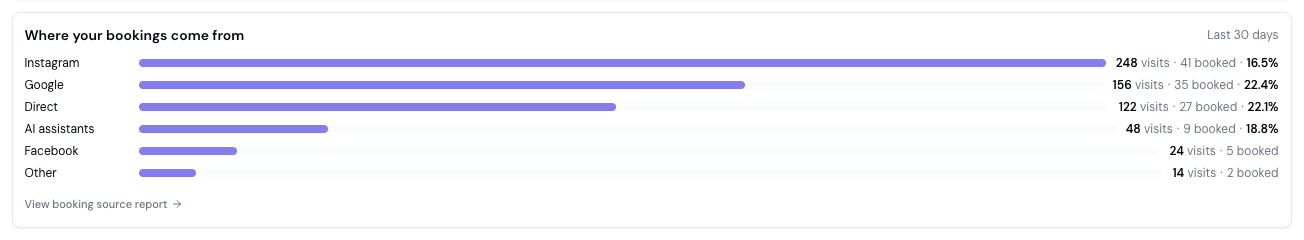
Where your bookings come from
Also under Detailed analytics, the Where your bookings come from card shows your booking-page traffic by channel over the last 30 days. A traffic source is where a visitor was just before they arrived on your booking page — the website or app that referred them. Bella works this out automatically from the referring site; there’s nothing to set up. Bella groups your traffic into six channels:- Instagram — Visitors who arrived from Instagram (for example, tapping your bio link).
- Facebook — Visitors who arrived from Facebook.
- AI assistants — Visitors referred by an AI assistant: ChatGPT, Gemini, Perplexity, Claude, or Copilot.
- Google — Visitors who arrived from Google (or Bing) search.
- Direct — Visitors with no referring site — they typed your link, scanned your QR code, or used a saved bookmark.
- Other — Any other referring site that doesn’t fall into the channels above. This includes your own website — if a visitor clicks a “Book Now” link on your own site, that visit currently counts under Other.
- Visits — Distinct visitors from that channel.
- Booked — How many of them completed a booking.
- Conversion % — The share of that channel’s visits that turned into bookings.
This is different from the Booking Source report
It’s easy to confuse two similarly-named things — they answer different questions:- Where your bookings come from (this card) measures the traffic channel — the outside source that sent a visitor to your booking page (Instagram, Google, an AI assistant, and so on). It’s based on the referring site.
- The Booking Source report in Reports measures the booking origin — how the appointment was created in Bella: Online Booking (the client booked themselves), Business Dashboard (your team booked it), or System (created automatically). It says nothing about which outside channel the client came from.
Devices
The Devices card shows how your booking-page visits split across Mobile, Desktop, and Tablet over the last 30 days, with each device’s share of total visits. It also breaks visits down by operating system — iOS, Android, macOS, and Windows — so you can see at a glance how many clients book from an iPhone versus an Android phone, or on a Mac versus a PC. Most booking traffic is on mobile — clients booking from Instagram, a text message, or on the go. When mobile dominates, it’s a prompt to make sure your booking page looks and works beautifully on a phone: clear service names, an easy time picker, and a fast checkout.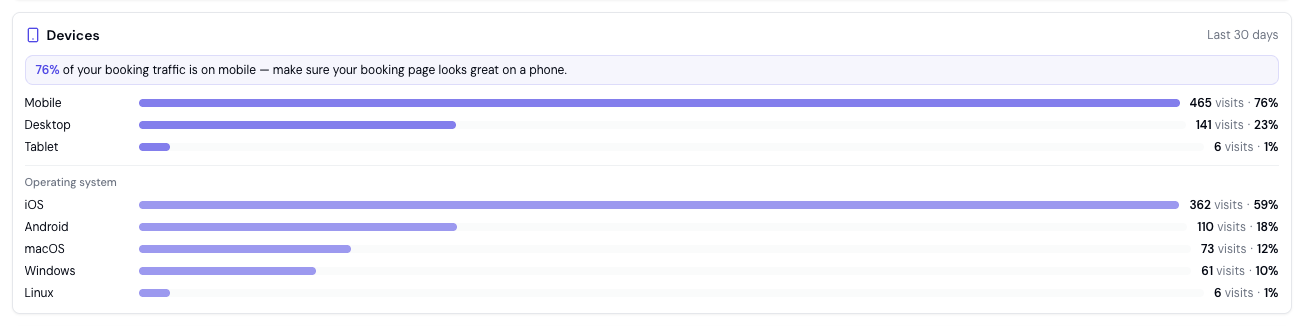
Most-booked services online
The Most-booked services online card lists the services clients add most often when booking online, over the last 30 days, ranked by how many booking sessions included each one. Use it to see what’s actually driving your online bookings. Feature your most popular services prominently on your booking page, and think about how to promote the ones you’d like booked more often.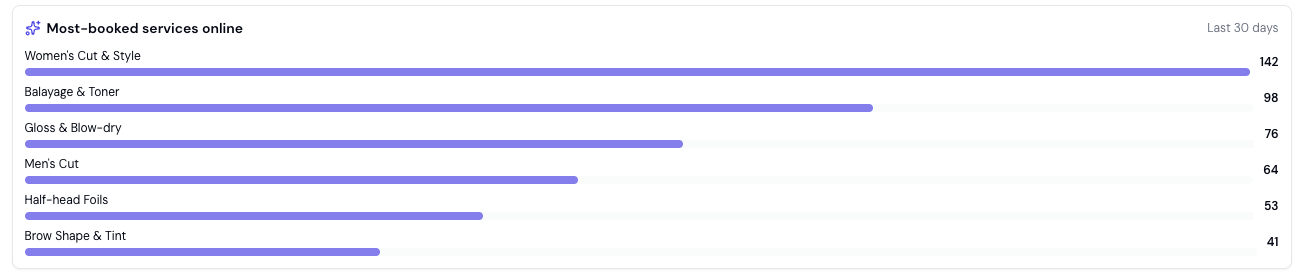
Peak booking times
The Peak booking times heatmap shows when clients are most active on your booking page across the week — by day and hour, in your business’s timezone, over the last 30 days. Darker cells are busier, and a short summary calls out your busiest window. Use it to plan around demand: keep online availability open when clients are looking, schedule team breaks for quieter periods, and time promotions or reminders for when your booking page is busiest.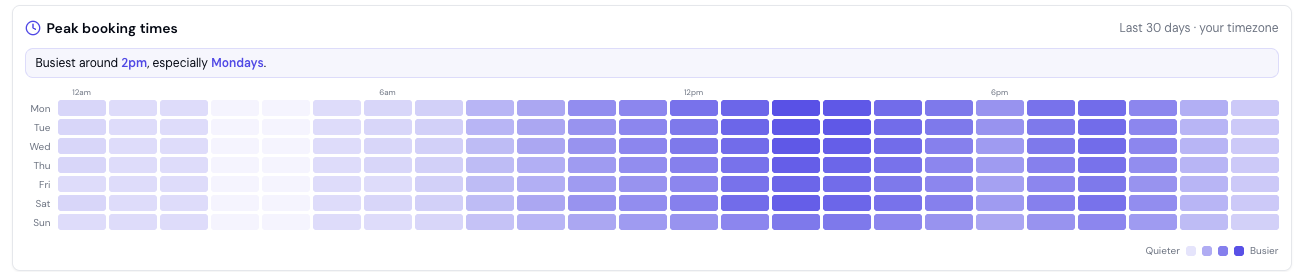
When you’ll see rates versus counts
Percentages are only meaningful when there’s enough data behind them. Until your booking page has had enough visits, Bella shows the counts but holds back the rates to avoid a misleading figure from a tiny sample.- In the funnel, you’ll see the visitor counts at each step with a note: “Too few visits to show step rates yet — counts only.” The step percentages and the amber drop-off appear once you have enough visits.
- The conversion rate in the performance cards is hidden below the same threshold, with a short note in its place.
FAQs
Q: Do I need to set up Google Analytics for this? A: No. The booking-page analytics on this page are built into Bella and measured automatically — no Google Analytics account and no tracking code. Separately, if you want your booking page to feed your own Google Analytics, Google Ads or Meta account (for example to measure ad spend), you can connect it — see Connect Your Own Analytics. Q: Why isn’t my own website shown as its own traffic source? A: Visits referred from your own website currently fall under the Other channel rather than appearing as a separate source. The six channels are Instagram, Facebook, AI assistants, Google, Direct, and Other. Q: What’s the difference between this and the Booking Source report? A: This page’s Where your bookings come from card shows the traffic channel — the outside site that referred a visitor (Instagram, Google, an AI assistant, and so on). The Booking Source report shows the booking origin — whether an appointment was created via Online Booking, the Business Dashboard, or the System. One is about how visitors found you; the other is about how the booking was created. Q: What does a dash (—) mean in the Today strip? A: A dash means that figure isn’t available yet, not that it’s zero. A genuine zero is shown as0.
Q: What does the “Booked” step in the funnel show?
A: It’s the share of visitors who completed their booking — the end of the journey. The funnel is most useful for spotting the step where visitors drop off; for the single headline figure of visits that became bookings, use the conversion rate in the performance cards.
Q: What timezone are peak booking times shown in?
A: Your business’s own timezone, so the busy hours line up with your day. The heatmap covers booking-page activity over the last 30 days.
Q: Why can’t I see any rates or percentages?
A: Your booking page may not have had enough visits yet. Bella shows counts and holds back rates until there’s enough data to be meaningful. The rates appear automatically as your traffic grows.
Q: Why don’t I see the Today strip?
A: It only appears when there’s been booking-page activity today. If there have been no visits, no started bookings, and no completed bookings yet, the strip stays hidden.
Note: Use these insights alongside the Dashboard for your overall business performance and Reports for detailed breakdowns. Together they show you both how your business is performing and how to win more bookings online.